Use the Observability dashboard
Monitor execution reliability, latency, approval volume, skill usage, tool usage, and recent runs.
Use the Observability dashboard to assess execution volume, reliability, latency, approvals, and resource usage across your runs. From the same view, filter recent executions and move to a full trace when aggregate data identifies a run that needs investigation.
Before you begin
You must be signed in and have access to the executions you want to monitor. Metrics are calculated for your accessible execution data, so an empty dashboard can mean that no runs have been recorded rather than that monitoring failed.
To generate an execution before using this guide, follow Run and find executions.
Monitor executions
Open Observability. Wait for the metric cards and recent-execution region to finish loading before interpreting the values.
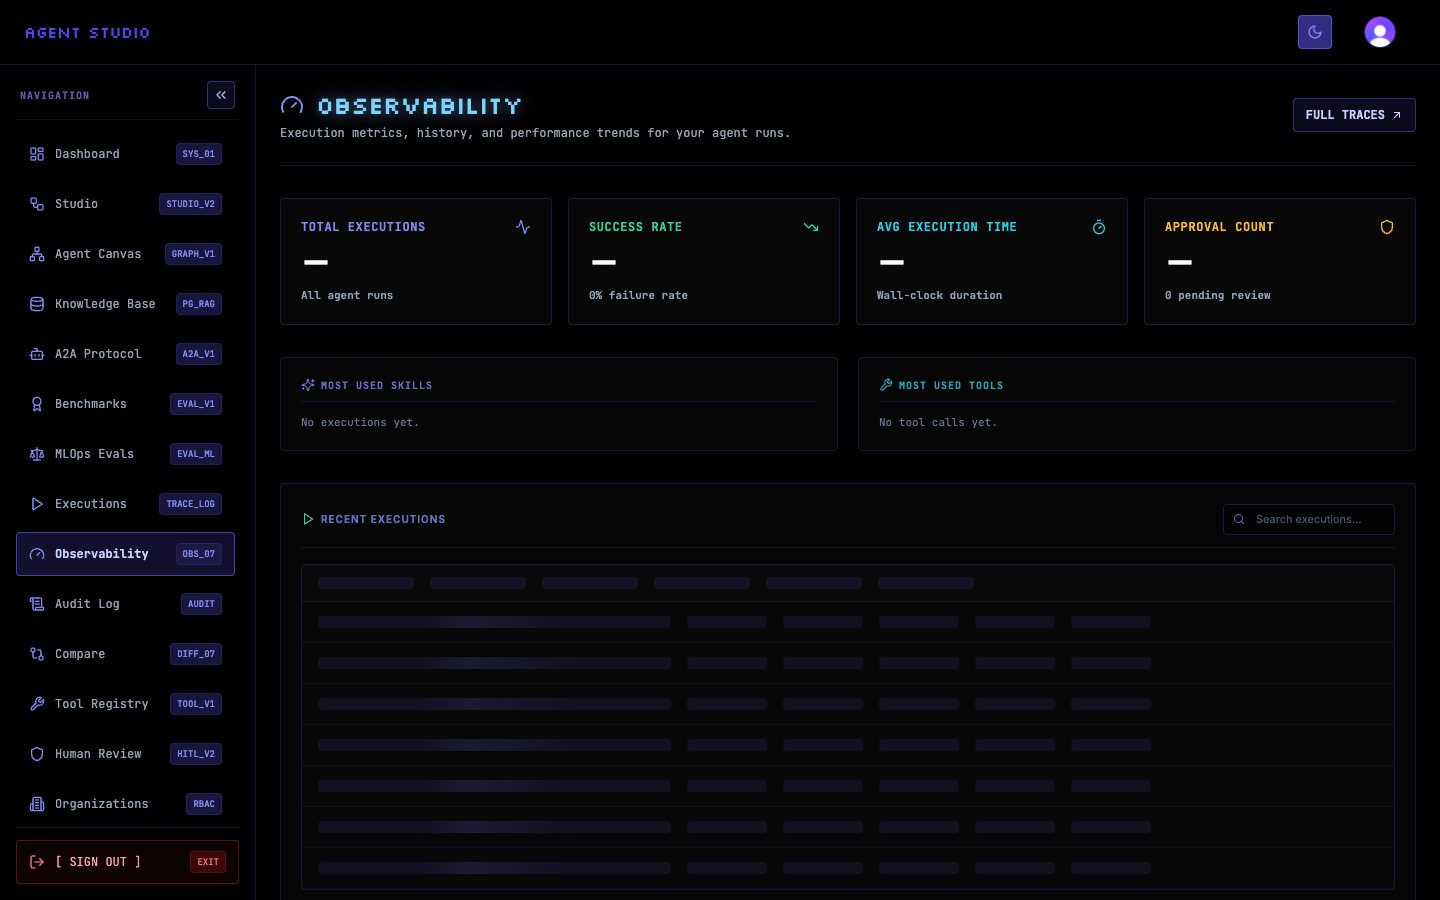
When there is no activity, MOST USED SKILLS displays No executions yet, MOST USED TOOLS displays No tool calls yet, and RECENT EXECUTIONS displays No executions found. These messages are valid empty states.
Review the four cards at the top of the dashboard:
- TOTAL EXECUTIONS counts all agent runs in the metric scope.
- SUCCESS RATE shows the successful-run percentage and pairs it with the failure rate.
- AVG EXECUTION TIME reports mean wall-clock duration in seconds.
- APPROVAL COUNT reports total approvals and the number pending review.
Treat the cards as related signals. For example, a lower success rate deserves more attention when total execution volume is large, and a rising approval count may explain why some runs remain paused.
Inspect the status breakdown beneath the headline cards. It groups executions by their recorded status and displays the count for each group.
Use this breakdown to distinguish failures from runs that are still active, paused, cancelled, or otherwise terminal. Then compare the relevant count with TOTAL EXECUTIONS before drawing a conclusion from a single status.
Read MOST USED SKILLS to see each skill name and its run count. Read MOST USED TOOLS to see each tool name and its call count.
These lists answer different questions: skill counts show which workflows run most often, while tool counts show which integrations or operations those workflows invoke. A skill can run without producing a tool-call count if its path does not call a tool.
In RECENT EXECUTIONS, enter a skill name or other known execution search term in Search executions…. Agent Studio updates the recent list after a short input delay and returns up to 50 matching executions.
Review the execution's skill, status, timing, and other table details. If the list displays No executions found, clear or broaden the search before concluding that no run exists.
Select the relevant recent execution to inspect that run, or select FULL TRACES to open the complete execution history surface.
The execution detail provides the trace, structured logs, timeline, and approval events available for that run. Use those details to explain an aggregate change rather than relying on dashboard percentages alone.
Verify your findings
Confirm that the dashboard's high-level values and the recent list tell a consistent story. If TOTAL EXECUTIONS is zero, usage lists and recent history should also be empty. If failures are present, filter or open full traces and identify the affected runs before starting recovery.
Troubleshooting
Next steps
Use Inspect an execution trace to diagnose a specific run, Review and cancel approval requests to clear pending decisions, or Recover and export executions to act on a failed execution.